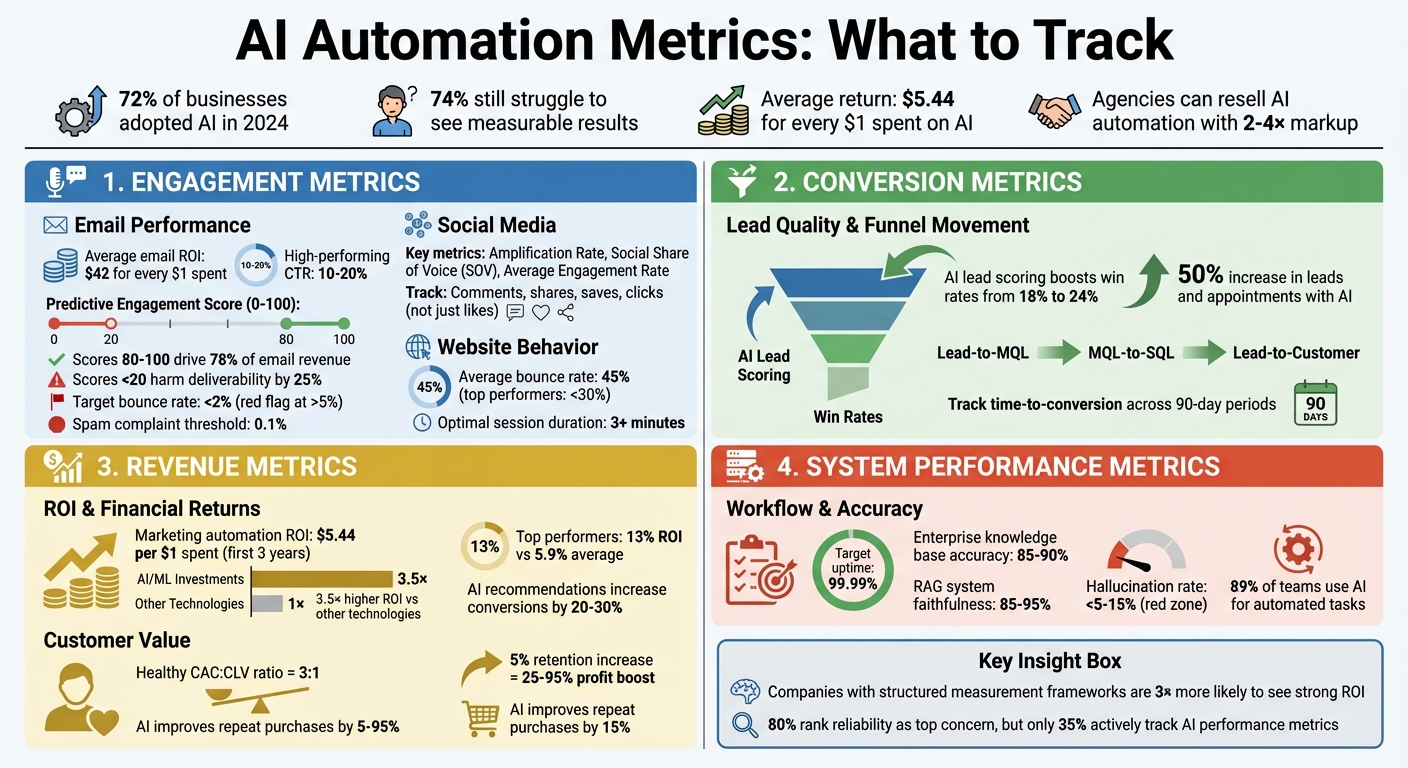
72% of businesses adopted AI in 2024, yet 74% still struggle to see measurable results. Why? They’re not tracking the right metrics. Metrics like ROI, lead quality, and engagement rates are the backbone of proving AI's value and scaling operations effectively. For agencies, this is even more critical - clients demand data-backed results, and tracking the right KPIs ensures you deliver.
Tracking metrics ensures your AI automation drives real results, not just vanity numbers like social impressions or email opens. Instead, focus on actionable insights like Cost Per Acquisition (CPA), Customer Lifetime Value (CLV), and conversion rates. These directly tie automation efforts to revenue and profitability, making it easier to justify investments and optimize campaigns.
Key Metrics to Monitor:
- Engagement Metrics: Click-to-open rates, amplification rates, and predictive engagement scores reveal how well your content connects with your audience.
- Conversion Metrics: Lead-to-MQL rates, MQL-to-SQL progression, and time-to-conversion measure how effectively your AI moves prospects through the funnel.
- Revenue Metrics: CPA, ROI, and CLV provide a clear picture of financial returns and long-term growth potential.
- System Performance: Workflow completion rates, error rates, and data quality metrics ensure your AI tools operate smoothly and efficiently.
Agencies can resell AI automation with a 2–4× markup by proving ROI through these metrics. With companies reporting an average return of $5.44 for every $1 spent on AI, tracking the right data isn’t just smart - it’s profitable. Start measuring today to make smarter decisions, scale faster, and deliver results your clients can see.
Essential AI Automation Metrics: Engagement, Conversion, Revenue & System Performance KPIs
Scaling AI for Maximum Business Impact – Key Metrics & Strategies
sbb-itb-537ed4c
Engagement Metrics to Monitor
Engagement metrics help you understand whether your AI-driven content connects with your audience or misses the mark. These numbers reveal how people interact with your email campaigns, social media posts, and website content. Without them, you're essentially flying blind when it comes to gauging how well your AI content resonates.
Email Performance Numbers
Email continues to be one of the most lucrative marketing channels, with an average return of $42 for every $1 spent. But with privacy updates like Apple Mail Privacy Protection inflating open rates, relying on basic metrics isn’t enough anymore. It's time to dig deeper.
Click-to-Open Rate (CTOR) is a more precise indicator of how relevant your content is. It measures the percentage of people who, after opening your email, actually clicked on a link. High-performing AI-powered campaigns often achieve CTRs of 10–20%.
Another powerful tool is Predictive Engagement Scoring, which ranks subscribers (on a scale of 0–100) based on how likely they are to open, click, or convert. Subscribers scoring between 80–100 typically drive 78% of email revenue, while sending emails to those scoring below 20 can harm deliverability by as much as 25%.
Keep an eye on bounce rates - aim for less than 2%. If your bounce rate exceeds 5%, it’s a red flag for list quality. Similarly, a spam complaint rate of just 0.1% can hurt your sender reputation and reduce inbox placement.
The YMCA of Alexandria used ActiveCampaign's AI tools to achieve a 12.8% click-through rate and grow their contact list by 27% across all branches. Digital Marketing Specialist Adam Sakry also reported saving 10 hours of manual work per campaign.
Social Media Activity
Social media metrics provide a snapshot of how well your AI-generated posts are engaging your audience. Look beyond surface-level metrics like likes and track deeper indicators like comments, shares, saves, and clicks to measure real interaction.
One useful metric is the Amplification Rate, which shows how often your followers share your content with their own networks. This reflects how far your reach extends beyond your immediate audience. Another is Social Share of Voice (SOV), which compares your brand mentions to competitors, helping you gauge your standing in the industry.
To measure overall engagement, calculate your Average Engagement Rate by dividing total interactions by your follower count. Pair this with sentiment analysis to ensure the engagement you’re generating is positive.
As Haily Moulton, Social Media Manager at Webflow, explains:
"UGC is a strong indicator of brand affinity, trust, and community engagement".
User-Generated Content (UGC) is a goldmine for assessing brand loyalty. When customers create content featuring your brand, it signals that your engagement efforts have evolved into genuine advocacy.
Before introducing AI tools, establish a baseline by tracking 3–6 months of manual performance data. This gives you a clear benchmark to measure the "AI uplift". You can also use the Prompt-to-Result Satisfaction Score (P2RSS) to evaluate how effectively AI-generated content meets expectations, rating it on a scale of 1–5 based on how many prompt attempts were needed.
Website Behavior Data
To complete the picture, analyze website behavior metrics. These numbers reveal whether your AI-driven marketing is compelling enough to keep visitors exploring. For instance, bounce rate measures the percentage of visitors who leave after viewing just one page. In 2025, the average bounce rate is around 45%, while top-performing sites keep it below 30%.
Metrics like average session duration and time on site shed light on how deeply visitors engage with your content. Websites with session durations over 3 minutes often see better conversion rates, as this indicates the content is holding attention. Additionally, track click-through rate (CTR) to identify which elements encourage users to dive deeper into your site.
In March 2023, optimizing landing pages led to a dramatic improvement - bounce rates dropped from 65% to 40%, organic sessions increased by 30%, and conversion rates rose by 20%.
Review these metrics weekly or biweekly to identify trends early. Adjust your AI prompts or content strategies as needed to address issues before they escalate. A/B testing can also help refine your content and layout by focusing on boosting CTR and lowering bounce rates.
Conversion and Revenue Metrics
Conversion and revenue metrics are the bridge between AI automation and your revenue goals. These numbers are what executives scrutinize to determine if your AI investments are delivering real financial returns. Building on engagement data, these metrics zero in on how effectively your efforts are converting interest into revenue.
Lead Quality and Sales Funnel Movement
Not all leads are created equal. Marketing Qualified Leads (MQLs) are those who’ve shown enough interest to warrant nurturing - whether by downloading a guide, attending a webinar, or engaging with your content multiple times. Sales Qualified Leads (SQLs) go a step further, signaling they’re ready for direct interaction with your sales team.
Metrics like lead-to-MQL progression rates help you evaluate whether your AI-powered campaigns are attracting the right audience. Meanwhile, MQL-to-SQL rates indicate if your nurturing efforts are effectively preparing prospects for sales conversations. Companies leveraging AI for lead management have reported up to a 50% increase in leads and appointments.
AI excels in lead scoring accuracy, replacing guesswork with data-driven predictions. By analyzing behavioral signals, AI can identify which leads are most likely to convert, boosting win rates from 18% to 24%. However, it’s essential to track how often your scoring system gets it right to ensure it’s more than just automated guesswork.
Another key metric is time-to-conversion, which measures how quickly leads progress from initial contact to a closed deal. A shorter sales cycle means greater efficiency across your funnel. Additionally, monitor the pipeline influenced by automation, which reflects the total value of deals impacted or accelerated by your AI workflows.
| Funnel Stage | Key Metric | Strategic Question Answered |
|---|---|---|
| Top of Funnel | Lead-to-MQL Rate | Are lead generation efforts attracting the right audience? |
| Middle of Funnel | MQL-to-SQL Rate | Is lead nurturing effectively preparing prospects for sales? |
| Bottom of Funnel | Lead-to-Customer Rate | How effectively is interest being converted into revenue? |
| Velocity | Time-to-Conversion | How quickly are leads moving through the funnel? |
| Quality | Lead Scoring Accuracy | Is the system correctly identifying high-value leads? |
It’s wise to track these metrics over a 90-day period rather than just 30 days. This ensures you’re observing sustained performance rather than temporary spikes.
"Your sales team's success no longer depends on how hard they work, but on how smart they work."
Once you’ve optimized lead progression, it’s time to examine acquisition costs and returns.
Cost Per Acquisition (CPA) and ROI
Cost Per Acquisition (CPA) is a straightforward way to measure how much you’re spending to acquire each new customer. To calculate it, divide your total sales and marketing expenses - including software, staffing, and ad spend - by the number of new customers acquired in a given timeframe.
Don’t forget to include hidden costs like integration, data cleansing, or prompt engineering when calculating CPA and ROI. Ignoring these can lead to misleading results.
For ROI, use this formula: (Revenue attributed to automation – automation costs) ÷ automation costs. On average, companies using marketing automation see a return of $5.44 for every $1 spent within the first three years. AI and machine learning investments generate a 3.5× higher ROI compared to other technologies. Top-performing companies report an average 13% ROI on AI initiatives versus a 5.9% average across all enterprises.
Accurate attribution modeling is essential. Move beyond "last-click" models to multi-touch or data-driven methods that credit automated touchpoints, such as AI-driven recommendations or nurture sequences. For example, AI-powered recommendations alone can increase conversion rates by 20–30%.
Segment CPA data by customer type, region, or channel. Averages can hide inefficiencies in specific areas.
"As your company scales, Customer Acquisition Cost becomes even more important - not just as a financial KPI, but as a strategic signal."
To maintain ROI, audit automated workflows regularly - monthly or quarterly - to identify where leads may be dropping off. Incorporate Human-in-the-Loop (HITL) reviews, where editors fact-check AI-generated content. This ensures accuracy and protects your brand reputation.
Customer Lifetime Value (CLV) and Retention Rates
To gauge long-term growth, focus on metrics like Customer Lifetime Value (CLV). This measures the total revenue a customer generates over their relationship with your business, offering insight into whether your AI efforts are driving sustainable growth or just quick wins.
CLV also helps guide your Customer Acquisition Cost (CAC) strategy. A healthy ratio is around 3:1 - for every dollar spent acquiring a customer, you should earn three dollars in return over their lifetime. A high CLV means you can afford to invest more in acquiring customers while staying profitable.
Retention metrics are equally critical. Increasing customer retention by just 5% can boost profits by 25% to 95%. AI-powered recommendation engines, for instance, have been shown to improve repeat purchase rates by 15%.
Keep an eye on churn rate to identify where customers may be dropping off in their journey. If churn is high, it may indicate issues in your onboarding or early engagement strategies. AI can also uncover cross-sell opportunities, increasing average deal size and directly enhancing CLV.
Automation can strengthen loyalty by personalizing touchpoints like renewal reminders or "anniversary" messages. These small gestures can significantly improve retention and, by extension, long-term profitability.
| Metric | Role in AI Strategy Evaluation |
|---|---|
| Customer Lifetime Value (CLV) | Measures total profitability and justifies AI software investment |
| Retention Rate | Tracks continued engagement after AI interactions |
| Churn Rate | Highlights issues in service quality or automated experiences |
| Repeat Purchase Rate | Indicates loyalty and the effectiveness of AI-driven recommendations |
"The true measure of success lies in how actionable and relevant these insights are to our clients."
CLV and retention metrics tie your automation efforts to real business outcomes, ensuring your AI investments are building a sustainable, growth-oriented future.
System Performance and Workflow Metrics
System performance metrics are your compass for understanding how effectively your AI is operating - and where it might be falling short. While 80% of companies rank reliability as a top concern, only 35% actively track AI performance metrics. This gap can lead to customer dissatisfaction and weaken trust in your automation systems. Ensuring reliable AI performance is critical to maintaining the conversion and revenue benefits we’ve discussed earlier. These metrics not only safeguard operational reliability but also complement conversion data by highlighting backend stability.
Workflow Completion Rates
Goal Completion Rate measures how often tasks are successfully completed from start to finish. For example, in a multi-step welcome email sequence, this metric reveals how many contacts make it through every step.
On the other hand, tracking the Journey Completion Rate helps identify where users drop off in your workflows. To address these gaps, conduct regular audits of your workflows. Document all active automations to pinpoint inefficiencies and areas for improvement.
Companies that adopt robust measurement frameworks are 3× more likely to see meaningful returns on investment. It all starts with ensuring your workflows complete what they set out to do.
Next, let’s look at error rates to better understand and enhance system stability.
Error Rates and Fixes
The Error Rate represents the percentage of failed or incorrect outputs compared to total inputs. Strive for an uptime standard of 99.99%, as even minor error rates can accumulate over time.
Take the example of the Kravet Internal AI project in late 2025. By implementing a measurement-driven optimization loop, expanding RAG sources, prioritizing structured over unstructured data, and fine-tuning model temperature settings, they boosted their assistant's accuracy from under 60% to nearly 90%.
Another key metric, Action Accuracy, measures the ratio of successful actions to failed ones. For enterprise knowledge base assistants, an accuracy range of 85%–90% is a strong benchmark. To measure progress, start by recording the error rate of manual processes as a "Day 0" baseline.
To safeguard your workflows, implement a kill switch for immediate rollbacks, set up emergency email templates, assign clear ownership, and layer your safeguards. Use automated alerts to catch workflow failures in real time.
"You can't manage what you don't measure." - Hussain Chinoy, Gen AI Technical Solutions Manager, Google Cloud
Additionally, monitor the AI-to-Human Completion Ratio to understand how many tasks are completed autonomously versus those requiring human intervention. At Zapier, 89% of teams rely on AI for tasks like writing code and sentiment analysis. The goal is to reduce human involvement over time while maintaining quality.
Beyond system stability, the quality of your data plays a pivotal role in the success of your automation.
Data Quality and Audience Segmentation
Even the most advanced AI models falter when fed poor-quality data. Evaluate your data using metrics like completeness, timeliness, uniqueness, and integrity. Outdated or incomplete data can result in flawed insights and automation errors.
To ensure your system predicts lead readiness accurately, monitor scoring accuracy. High-performing RAG systems aim for faithfulness rates between 85%–95%, with hallucination rates kept under 5%–15%.
Syed Balki, Founder of WPBeginner, shared:
"Our RGI [Resolution Gap Index] revealed that our models were technically accurate but contextually incomplete."
This metric highlights the gap between AI recommendations and actual resolutions, exposing areas where AI lacks context - such as missing customer tier information or purchase history.
Keep an eye on the Unsubscribe Rate as a warning signal for poor targeting or audience fatigue. Sudden increases often point to segmentation issues or irrelevant messaging. Real-time dashboards can help you catch these problems early.
To maintain fairness and transparency, conduct weekly audits across customer segments to identify bias and ensure decision-making remains clear. 61% of senior leaders now place a high priority on responsible AI governance to mitigate ethical risks. Colleen Barry, Head of Marketing at Ketch, highlights:
"Ethics and bias are more than just technical concerns - they're at the heart of how we build trust with our users and customers."
Fully integrate your automation platform with your CRM to track end-to-end metrics like Lead-to-MQL conversion rates and Customer Lifetime Value. Standardize tracking frameworks to align data across various AI tools. With 40% of marketers using automation to improve data quality, you can’t afford to skip this step. High-quality data not only enhances automation but also strengthens the engagement and conversion metrics that fuel your campaigns.
Review Schedule and Optimization Process
Regular reviews turn raw data into meaningful actions. Research shows that organizations with structured measurement frameworks are three times more likely to see a strong return on their AI investments. Yet, a staggering 74% of companies haven't experienced measurable benefits from their AI initiatives - often due to the absence of a clear review process.
The secret lies in balancing short-term monitoring with long-term analysis. Daily and weekly checks help catch immediate issues, like trigger misfires or sudden drop-offs in workflows, while monthly and quarterly reviews uncover larger trends that guide strategic scaling decisions. Without this structured rhythm, businesses risk missing critical signals - or worse, expanding systems that are already underperforming.
Daily and Weekly Checks
Daily monitoring ensures your AI systems remain operational and effective. Keep an eye on real-time indicators like unexpected spikes in unsubscribe rates, workflow interruptions, or trigger misfires. Use real-time dashboards to spot these issues and address them quickly.
Prompt-to-result satisfaction is another key metric to track daily. For example, refining prompt techniques improved satisfaction scores from 2.7/5 to 4.3/5 in one case study. This ensures that AI outputs remain accurate and useful for end-users.
Weekly reviews shift the focus to short-term engagement patterns. Analyze metrics like open rates, click-through rates (CTR), and workflow completion percentages to identify bottlenecks. Another critical metric is the AI-to-human completion ratio, which measures how much work AI handles autonomously versus tasks requiring human intervention. For instance, in 2025, John Xie, CEO of Taskade, used this metric to optimize autonomous agents. When the ratio dipped in certain workflows, his team identified missing context and improved the AI’s memory, leading to better performance.
Track daily prompts per active user, aiming for 15–25 prompts. If your weekly review highlights a specific drop-off in an automated journey, prioritize improving that trigger or content immediately. Similarly, if unsubscribe rates exceed 1%, audit your list and refine segmentation to address the issue.
These daily and weekly insights set the stage for more in-depth monthly and quarterly reviews.
Monthly and Quarterly Analysis
Monthly and quarterly reviews provide a broader perspective, helping you distinguish between short-lived performance spikes and sustained improvements. This approach also highlights "model decay", where an AI model that excelled in Q1 may falter by Q3, signaling the need for retraining rather than scaling. Amit Ashwini, Marketing Strategist at DataDab, emphasizes this point:
"Your top-performing model in Q1 could be useless by Q3. Retrain regularly, or your 'intelligence' becomes artificial in all the wrong ways."
These reviews should focus on ROI and customer lifetime value (CLV) trends over 6–12 months. Benchmark savings in costs and labor hours quarterly to identify resources that can be redirected to more strategic activities. For example, companies using marketing automation report an average return of $5.44 for every $1 spent within the first three years.
Segment adoption data by department to identify high-performing teams or "power users" who can champion broader AI adoption across the organization. Once a company crosses a 30% adoption threshold, AI implementation often accelerates. When reporting to leadership, focus less on technical metrics like accuracy and more on business outcomes, such as reduced time-to-market or cost savings.
The insights from these reviews guide adjustments and scaling efforts.
Adjustments and Scaling
Building on the patterns identified in daily, weekly, and monthly reviews, refine workflows by pinpointing where users drop off before reaching their goal. If gaps in resolution exist, shift the focus from isolated accuracy to improving the AI's contextual awareness and memory of past interactions.
For example, in June 2025, Syed Balki, founder of WPBeginner, used a "resolution gap index" (RGI) to improve their customer service AI. The data revealed that while the AI was technically accurate, it lacked context, such as customer tiers and past interactions:
"Our RGI revealed that our models were technically accurate but contextually incomplete."
By enhancing conversation memory and relationship history, their team reduced the RGI and improved overall effectiveness.
Refine prompts based on satisfaction scores. If users need multiple attempts to achieve their desired result, provide better training or more context to the AI agent. Use reporting tools to flag delays, trigger misfires, or logic errors in automated workflows.
Scale successful nurture sequences by analyzing ROI and CLV data. For instance, in 2025, Viraj Lele, an industrial engineer at DHL, linked AI model accuracy to business outcomes on their eCommerce platform. Optimizing their AI recommendation engine resulted in a 12% increase in average order value and a 15% rise in repeat purchases. Jessica Lau, Senior Content Specialist at Zapier, captures the essence of this approach:
"The goal isn't to just use AI - it's to use AI to speed things up or make things better."
FAQs
What key metrics should I track to measure the success of AI automation in my business?
To make your AI automation efforts truly effective, it’s important to track a handful of key metrics that reveal how well your systems are performing and contributing to your business goals:
- Model performance: Metrics like accuracy, precision, and recall are vital for determining how dependable your AI is when making predictions or decisions. These numbers can tell you if your model is hitting the mark or needs adjustments.
- Financial impact: Keep tabs on metrics like ROI, revenue uplift, and cost-per-acquisition (CPA). For instance, calculating how much revenue your business generates for every dollar spent can provide a clear picture of profitability and long-term value.
- Operational efficiency: Evaluate how AI is improving productivity by tracking time saved, task throughput, and latency. These figures can demonstrate whether automation is genuinely streamlining workflows or if there’s room for improvement.
- Engagement and outcomes: Metrics such as conversion rates, open rates, click-through rates, and customer satisfaction scores (like NPS) can indicate how well AI-driven campaigns are connecting with users and delivering meaningful results.
By keeping a close eye on these metrics, businesses can fine-tune their AI systems, validate their investments, and ensure their strategies stay effective and aligned with broader objectives.
Why is it important to track engagement metrics in AI-powered marketing campaigns?
Tracking engagement metrics such as open rates, click-through rates, and session duration gives AI tools the ability to understand audience behavior as it happens. With this information, the AI can pinpoint which audiences are most engaged, figure out the ideal times to connect, and fine-tune content to make it as effective as possible.
By leveraging these insights to adjust campaigns, businesses can create more tailored experiences, drive better conversion rates, and see a noticeable increase in ROI. Keeping an eye on these metrics ensures that your AI-powered marketing efforts remain focused and deliver tangible results.
Why is it important to track conversion and revenue metrics in AI-powered marketing?
Tracking conversion and revenue metrics plays a critical role in evaluating the success of your AI-driven marketing campaigns. These numbers reveal whether your efforts are translating into actual sales and delivering a measurable return on investment (ROI).
By keeping a close eye on these metrics, you can spot strategies that aren’t meeting expectations, make smarter budget adjustments, and ensure every marketing dollar is working toward your business objectives. In short, tracking these figures ensures your campaigns stay focused and deliver the best possible results.