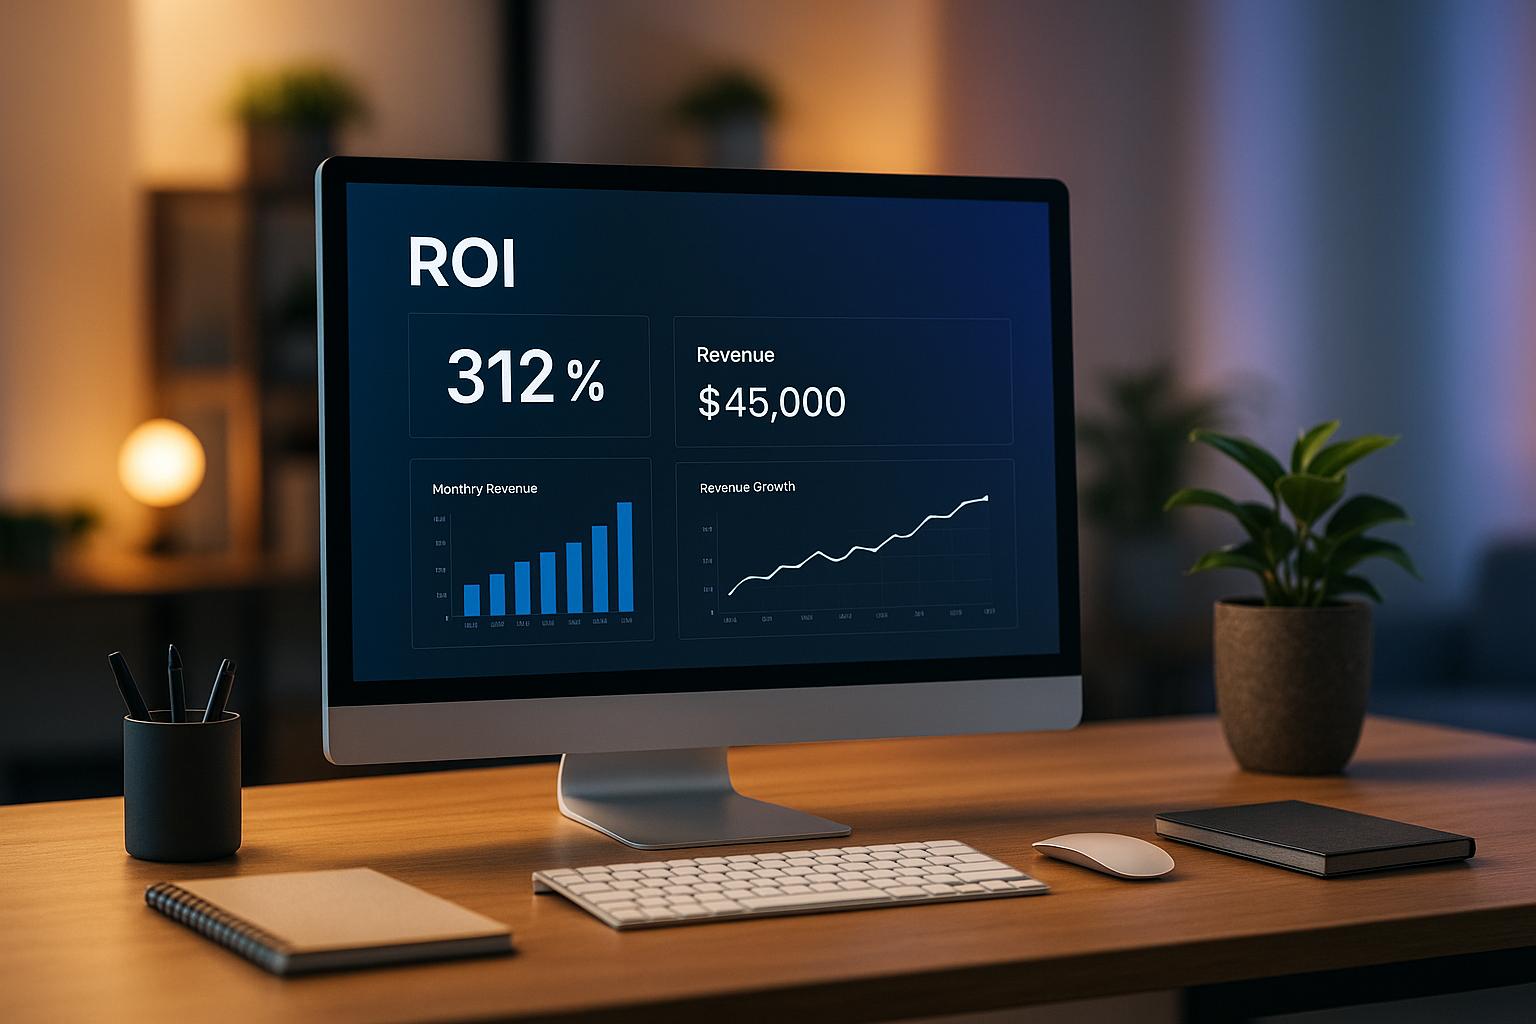
Agencies that track ROI metrics see higher profits and scalable growth. Why? Because these metrics reveal which campaigns drive revenue, which clients are worth the investment, and where resources are being wasted. Plus, with white-label AI tools, agencies can automate reporting, reduce errors, and even resell solutions for 2–4× markups.
Tracking ROI isn’t just about numbers - it’s about showing clients the value of their investment and boosting your agency’s bottom line. Here are the 5 key metrics every agency should monitor:
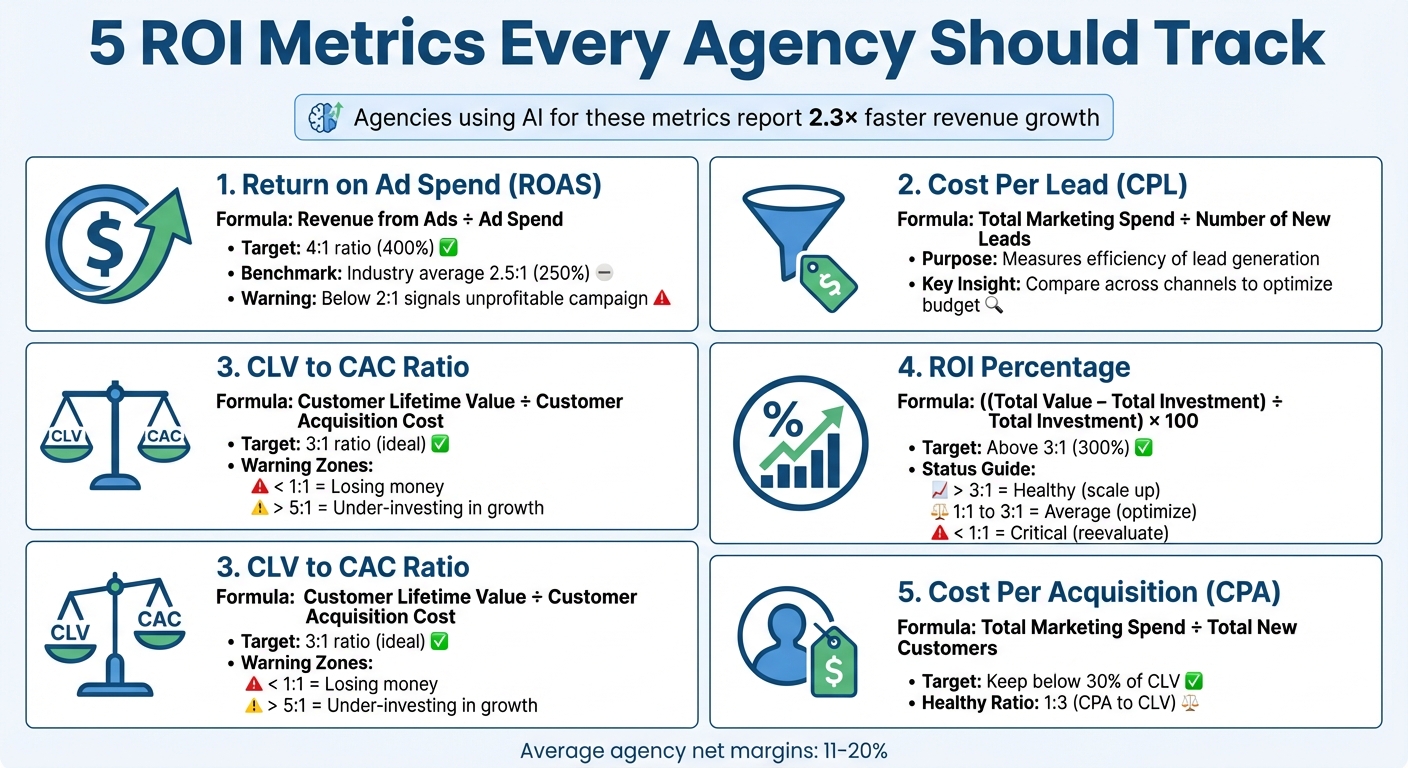
- Return on Ad Spend (ROAS): Measures how much revenue you generate for every dollar spent on ads. A 4:1 ROAS is the goal for profitability.
- Cost Per Lead (CPL): Tracks how much it costs to generate a single lead. Lowering CPL ensures efficient marketing spend.
- Customer Lifetime Value (CLV) to Customer Acquisition Cost (CAC) Ratio: A 3:1 ratio means sustainable growth. Anything less signals overspending.
- ROI Percentage: A universal metric to measure campaign profitability. Aim for a 3:1 return or higher.
- Cost Per Acquisition (CPA): Focuses on the cost of acquiring a customer. Keep CPA below 30% of CLV for healthy margins.
Quick Tip: Agencies leveraging white-label AI for these metrics report 2.3× faster revenue growth and reduce costs by automating tasks like data collection, lead scoring, and reporting. Some even turn these tools into recurring revenue streams.
Ready to refine your ROI strategy? Let’s break down each metric and how white-label AI can help you drive profit.
5 Essential ROI Metrics Every Agency Should Track
How to Measure Your Marketing ROI the Right Way
sbb-itb-537ed4c
1. Return on Ad Spend (ROAS)
Calculating Return on Ad Spend (ROAS) is essential for understanding the value of your ad campaigns and tracking overall performance. ROAS specifically measures how much revenue your agency generates for every dollar spent on advertising, making it a focused metric for assessing ad efficiency.
For agencies juggling multiple client campaigns, ROAS becomes a key tool to decide where to allocate budgets effectively. It helps pinpoint which campaigns are worth scaling and which ones need adjustments or pausing. Additionally, ROAS enhances client transparency by clearly illustrating how their ad investments translate into revenue.
A study from Nielsen in 2016 found that the average ROAS across industries was approximately 250% (or $2.50 earned for every $1 spent). For most campaigns, a ROAS of 4:1 (400%) is considered the threshold for profitability. On the other hand, anything below 2:1 (200%) signals that the campaign isn’t generating enough revenue to justify its costs.
How to Calculate ROAS
The formula for calculating ROAS is simple:
ROAS = Revenue from Ads / Ad Spend.
For instance, if you spend $5,000 on ads and generate $20,000 in revenue, your ROAS would be 4:1.
To ensure accuracy, include indirect costs like creative production, agency fees, and platform charges in your calculations. Ignoring these can inflate ROAS and give a misleading impression of profitability.
Another key metric is the break-even ROAS, which you can calculate as 1 / (profit margin %). For example, if your profit margin is 25%, you’ll need a 4:1 ROAS to break even.
Accurate ROAS data not only provides clarity but also serves as a foundation for leveraging AI tools to refine your ad strategies.
How to Improve ROAS with White-Label AI
White-label AI tools can take your ROAS optimization to the next level by automating tasks like data collection, attribution, and performance visualization. This reduces human error and saves valuable time.
One standout feature is automated bidding. Instead of relying on manual adjustments or gut instincts, AI platforms adjust bids in real time to achieve your target ROAS within a set budget. Agencies using first-party data in their AI strategies have reported up to a 30% improvement in campaign performance.
AI also enhances targeting by creating lookalike audiences based on high-value customers, which can significantly increase conversions and boost ROAS. Some advanced tools even integrate conversation intelligence to track offline conversions - such as phone calls - and link them back to specific ad spends. This provides a more complete view of campaign effectiveness.
Justin Hoffman from AgencyAnalytics puts it succinctly:
"To show clients their ROI, track and report on the revenue and conversion data that are directly attributed to your PPC campaigns... By comparing these metrics to the amount spent on advertising, you show clients the actual impact of their investment."
Ready to grow your white-label business? Thousands of agencies, consultants, and solution providers have already transformed their offerings with white-label technology. Start delivering enterprise-level solutions under your brand today - no engineering required. Enjoy faster launches, higher margins, and scalable services, all while keeping your brand front and center. Learn more
2. Cost Per Lead (CPL)
Cost Per Lead (CPL) represents the amount your agency spends on marketing and advertising efforts to secure a single potential customer. Unlike broader metrics, CPL hones in on how efficiently your campaigns perform, helping pinpoint which marketing channels are delivering results and which ones are draining your budget without enough return.
For agencies juggling multiple client accounts, CPL is a vital metric for smarter budget allocation. It’s not just about generating leads - it’s about generating the right leads. Pairing CPL with lead stages, such as Marketing Qualified Leads (MQLs) and Sales Qualified Leads (SQLs), can provide insight into whether you’re attracting high-value prospects your sales team can convert. This level of clarity guides more precise budget decisions and measures campaign effectiveness.
"We really focus on leads, and particularly which ones are MQL's (Marketing Qualified Leads) and SQL's (Sales Qualified Leads) because then we can fix any issues - whether there is a low number of opportunities coming from marketing, or if sales is having a harder time closing deals".
Tim Brown, CEO of Hook Agency, highlights how a high CPL can inflate Customer Acquisition Costs (CAC), cutting into margins and ROI. With marketing budgets tightening - dropping from 12.1% of company revenue in 2016 to 11.3% in 2017 - tracking CPL accurately is essential for justifying every dollar spent.
How to Calculate CPL
The formula for CPL is simple:
CPL = Total Marketing Spend / Number of New Leads.
For instance, if you spend $4,500 on a Google Ads campaign and generate 45 leads, your CPL is $100.00. Compare that to an SEO campaign costing $12,000 that generates 400 leads - the CPL drops to $30.00. This example, from a B2B startup managed by Wall Street Prep in May 2022, showcases the variance in efficiency across channels.
Breaking down CPL by marketing channel - whether it’s social media, email, SEO, or PPC - gives a clearer picture of where to allocate resources. For example, a law firm that generated eight leads at $125 CPL found several of those leads converting into high-value clients, proving the channel’s worth.
How White-Label AI Reduces CPL
White-label AI tools can dramatically lower CPL by automating tasks like source attribution and lead scoring, ensuring your budget targets the most valuable channels . AI tracks the entire customer journey, offering precise multi-touch attribution to identify which channels drive actual conversions, rather than relying on outdated last-click models.
To make the most of AI, establish 8–12 weeks of baseline data and integrate AI tools with your CRM for accurate lead attribution . Automated lead scoring based on user behavior and engagement helps identify high-value prospects, cutting down on wasted spend for low-potential leads.
"The reduction of CPL while increasing the number of leads within the pipeline should theoretically cause a company's revenue and profit margins to increase".
Wall Street Prep underscores this connection. While 95% of AI investments initially struggle to show measurable returns - not due to a lack of impact but rather challenges in tracking value - proper integration and data analysis are key to proving ROI.
Next, we’ll dive into tracking Customer Lifetime Value (CLV) against Customer Acquisition Cost (CAC) for a more comprehensive view of ROI.
3. Customer Lifetime Value (CLV) to CAC Ratio
The CLV to CAC ratio examines the link between the total revenue a customer generates over their lifetime and the cost to acquire that customer. Think of it as a way to gauge the efficiency of your marketing spend. For agencies, the sweet spot is a 3:1 ratio - every dollar spent on acquiring a customer should ideally bring in three dollars in lifetime value. This ratio helps determine whether your business model is sustainable or if you're overspending on clients who don’t generate enough revenue.
If your ratio falls below 1:1, you’re essentially losing money on every customer. On the flip side, a ratio above 5:1 could indicate you’re not investing enough in growth, potentially missing out on opportunities to expand your market share. As Bruce Hogan, CEO of SoftwarePundit, explains:
"For startups, ensure that CLV is at least three times the CAC to secure sustainable growth."
It’s also worth noting that acquiring a new customer can cost up to five times more than retaining an existing one. By analyzing this ratio across different customer segments instead of relying on an average, agencies can identify which segments offer the highest value and where resources are being wasted.
CLV to CAC Ratio Guide
Here’s a quick breakdown of what different ratios mean and the actions they suggest:
| CLV:CAC Ratio | Meaning and Suggested Action |
|---|---|
| < 1.0x | Unsustainable – losing money per customer. Pause scaling and focus on improving revenue per customer or reducing acquisition costs. |
| ~3.0x | Ideal – sustainable and profitable. Stick to your strategy and look for small improvements. |
| > 5.0x | Under-investing – missing growth opportunities. Increase marketing efforts to capture more market share. |
How to Calculate the CLV to CAC Ratio
The formula is simple:
CLV to CAC Ratio = CLV ÷ CAC.
When calculating, make sure to include all relevant costs - this means labor, software subscriptions, management fees, and any other expenses tied to acquiring and retaining customers. To determine CLV, a common method is:
(Average Revenue Per Account × Gross Margin) ÷ Churn Rate.
For CAC, use:
Total Sales and Marketing Expenses ÷ Number of New Customers Acquired.
Peter Thaleikis of Bring Your Own Ideas offers a key caution:
"If your customer acquisition costs exceed your customer lifetime value, your business is in trouble. But even if your lifetime value per customer exceeds your costs to acquire a customer, you might have issues if the customer pays a low amount over a long time."
Leveraging White-Label AI for Better CLV Tracking
Once you’ve nailed down the numbers, white-label AI can take your CLV tracking to the next level. By integrating with CRMs like HubSpot, Salesforce, and Zoho, AI tools can automate CLV forecasting using real client data . These systems analyze historical trends and predict future behaviors, giving you a more precise picture of long-term value . This matters because 64% of companies now base their marketing budgets on past ROI performance.
AI also enables multi-touch attribution, which is crucial for long sales cycles (90–365 days). Instead of relying on outdated last-click models, AI maps out the influence of every touchpoint in the customer journey. The result? Branded, client-ready dashboards that provide real-time insights into your CLV to CAC ratio, making it easier to justify premium retainers .
Beyond tracking, white-label AI can reduce CAC by automating tasks like client onboarding and reporting . Agencies can even resell AI-powered tools - like white-label AI chatbots or call systems - as subscription-based services, turning what was once a cost into a revenue stream. By aligning acquisition costs and lifetime value through AI, agencies can fine-tune their ROI strategies across the board. It’s no wonder businesses that focus on measuring marketing ROI are 12 times more likely to achieve higher returns.
4. Return on Investment (ROI) Percentage
ROI percentage is a straightforward way to measure profitability across campaigns. Along with metrics like ROAS, CPL, and CLV to CAC, it provides a big-picture view of how well your campaigns are performing financially. Unlike metrics that focus on specific aspects or customer groups, ROI percentage gives a universal measure that spans campaigns, channels, and client accounts. The formula is simple:
ROI Percentage = ((Total Value Generated – Total Investment) / Total Investment) × 100.
For instance, if you invest $10,000 in a campaign and generate $40,000 in revenue, your ROI comes out to 300%. This level of clarity supports smarter budget decisions and sharper strategies. As a universal metric, ROI percentage serves as a foundation for refining other ROI-related measurements.
To ensure accurate tracking, include all relevant costs - such as ad spend, software, labor, and integration fees. A good rule of thumb is aiming for a marketing ROI above 3:1. Falling below 1:1, however, signals a campaign is losing money. Jessica Weiss of One Firefly emphasizes the importance of going beyond the numbers:
"Most clients do not want to get lost in the weeds when it comes to determining ROI for their marketing investment. Don't just show the metrics. Show the WHY behind the metrics."
| ROI Ratio | Status | Action |
|---|---|---|
| > 3:1 | Healthy | Scale up and optimize |
| 1:1 to 3:1 | Average | Look for efficiency gains |
| < 1:1 | Critical | Reevaluate strategy urgently |
How to Calculate ROI Percentage
Start by defining Total Value Generated, which could include direct revenue, cost savings, or productivity improvements. Then, calculate Total Investment, factoring in costs like tools, labor, and API fees. For campaigns with long sales cycles, track ROI over a 6–12 month period to capture the full picture. Use historical data to set benchmarks and analyze ROI by channel - whether it’s paid search, social media, or email marketing - to identify your most successful acquisition strategies.
How White-Label AI Improves ROI Tracking
Tracking ROI manually can get messy, especially when multiple touchpoints are involved. This is where data-driven attribution (DDA) steps in. By using machine learning algorithms, DDA assigns credit to each interaction in the customer journey. White-label AI platforms take this further by automating the process. They integrate directly with your CRM and ad accounts, pulling real-time data to calculate ROI with precision.
Companies that adopt AI-driven ROI tracking report 2.3× higher revenue growth rates compared to traditional methods. For agencies, this means faster reporting, smarter budget recommendations, and stronger arguments for premium retainers. Some agencies even resell white-label AI tools - like automated reporting dashboards or voice AI systems - as subscription services. This turns operational costs into recurring revenue streams, with markups ranging from 2.5× to 4×. Considering that 74% of enterprises report achieving positive AI ROI within 12 months, automation is no longer optional - it’s essential.
5. Cost Per Acquisition (CPA)
Building on our discussion of ROI percentages, Cost Per Acquisition (CPA) focuses on how efficiently you’re acquiring customers, rounding out your ROI toolkit.
CPA measures the average cost of acquiring a single customer through a specific campaign or channel. Unlike broader metrics, CPA zeroes in on actual conversions - whether that’s a sale, sign-up, or qualified lead. This makes it especially important for performance-driven campaigns since it directly ties marketing spend to customer acquisition.
A good rule of thumb is to keep CPA below 30% of your Customer Lifetime Value (CLV). For instance, if you’re spending $75 to acquire a customer who will generate $250 in lifetime revenue, your campaigns are running efficiently. However, when CPA starts to creep up and take a bigger chunk of CLV, it’s a clear sign you need to make adjustments. CPA is also a valuable tool for identifying which channels are delivering the best results, helping you prioritize your budget.
How to Calculate CPA
The formula for CPA is straightforward:
CPA = Total Marketing Spend / Total New Customers Acquired.
For example, if you spend $5,000 on a campaign and bring in 50 new customers, your CPA is $100. For more granular insights, you can use this formula:
CPA = Cost to Advertiser / (Number of Ad Impressions × CTR × CR).
This detailed approach helps pinpoint whether high CPA is due to low click-through rates (CTR), which could indicate weak ad creatives, or low conversion rates (CR), which might mean your landing pages need work. To ensure profitability, compare CPA to CLV. A healthy ratio is about 1:3, where CPA is one-third of CLV. For campaigns with longer sales cycles, track CPA over 6–12 months to get a more accurate picture of your marketing efforts. You can also lower CPA by A/B testing ad copy and landing pages to improve conversion rates without increasing your spend. Like other ROI metrics, CPA tracking helps agencies refine their strategies and allocate resources for maximum profitability.
How to Lower CPA with White-Label AI
White-Label AI Solutions simplify CPA tracking by integrating directly with CRMs and ad accounts, pulling real-time data to give you a complete view of acquisition costs across all channels. For example, Windstream’s Kinetic division used AI-powered call tracking to cut their CPA by 17%, capturing 60% of their leads via phone.
Agencies that leverage AI-driven marketing often report significantly lower CPAs - an average of $27 compared to $43 with traditional methods. AI tools like chatbots and automated email sequences keep leads engaged, reducing drop-offs and driving down conversion costs. For industries like insurance or home services, where many orders happen over the phone, AI call tracking digitizes these offline conversions and attributes them to the right campaigns, ensuring CPA calculations are accurate.
Additionally, many agencies resell White-Label AI Solutions as subscription-based services. This not only helps their clients reduce acquisition costs but also generates recurring revenue streams, with typical markups ranging from 2.5× to 4×. By combining AI with efficient CPA management, agencies can maximize profitability for both themselves and their clients.
Conclusion: Scale Your Agency with Better ROI Tracking
Keeping an eye on key ROI metrics is the backbone of building a profitable agency that can grow sustainably. By consistently tracking figures like ROAS, CPL, CLV-to-CAC ratios, ROI percentages, and CPA, you gain the clarity needed to spot and fix bottlenecks, allocate resources wisely, and forecast revenue with confidence. With the average agency operating on net margins between 11–20%, every improvement in efficiency directly boosts your bottom line.
Adding white-label AI into the mix simplifies complex workflows and delivers measurable cost savings. When combined with regular tracking of these metrics, AI not only automates reporting but also enhances decision-making. For instance, a digital marketing agency managing over 150 clients adopted white-label voice AI for handling routine inquiries. The result? They reaped $233,000 in benefits within the first year, including $60,000 in new revenue from reselling the AI as a subscription service - achieving a 417% ROI.
Tools like automated dashboards and AI solutions amplify ROI by freeing up time that can be reinvested into closing deals, expanding service offerings, or retaining clients. Considering it’s 70% cheaper to retain an existing customer than to acquire a new one, tracking metrics like CLV and retention rates is critical for long-term success. These efficiency gains allow you to redirect resources toward growth opportunities and new innovations.
Ready to Launch Your White-Label Business? Thousands of agencies, consultants, and solution providers have already transformed their business models with white-label technology. Start offering enterprise-grade solutions under your brand today - no need for engineering expertise. The payoff? Faster launches, higher profit margins, and scalable services that keep your brand in the spotlight while robust platforms handle the heavy lifting. Check out innovaai.io to explore white-label AI solutions that agencies often resell at 2.5× to 4× markup.
FAQs
How do white-label AI tools help agencies track and improve ROI?
White-label AI tools give agencies a powerful way to track ROI and boost efficiency - all while operating under their own brand. These tools take raw performance data and transform it into actionable insights like time saved, lower costs, increased revenue, and improved team productivity, all seamlessly integrated into the agency’s client portals.
With advanced reporting features, agencies can standardize crucial metrics such as cost per lead, customer acquisition cost, and lifetime value. This makes it easier to consistently compare performance across campaigns and clients. Automated attribution models and real-time visualizations cut down on manual data work, minimize errors, and free up teams to focus on strategic initiatives.
What’s more, the AI evolves over time, continuously refining metrics like predictive uplift and conversion rates. This dynamic approach helps agencies make quicker, data-driven decisions, deliver better results for clients, and scale their operations with ease.
What is the ideal Customer Lifetime Value (CLV) to Customer Acquisition Cost (CAC) ratio for sustainable growth?
For consistent growth, a healthy CLV-to-CAC ratio is typically around 3:1. In simple terms, for every dollar spent to bring in a customer, their lifetime value should ideally return three dollars. If the ratio falls below 2:1, it often signals issues with either acquisition costs or retention strategies, which could hurt long-term profitability.
Monitoring this ratio allows agencies to stay focused on profitability while building a business model that can scale effectively over time.
What’s the difference between ROAS and ROI when measuring campaign performance?
ROAS, or Return on Ad Spend, measures how much revenue you generate for every dollar spent on advertising. It’s a precise way to gauge the efficiency of your ad campaigns.
On the flip side, ROI (Return on Investment) takes a wider lens, evaluating the overall profitability of a campaign. It factors in net profit relative to all costs, not just your ad spend.
While ROAS zeroes in on short-term ad performance, ROI offers a bigger picture, helping you understand the long-term success of your overall investment strategy.